


Case Studies
Case Studies
- Preparation of Hyperbranched Resin and Its Effect on the Performance of Epoxy Resin Channeling Control Agent (Part 1)
- Preparation of Hyperbranched Resin and Its Effect on the Performance of Epoxy Resin Channeling Control Agent (Part 2)
- Construction of A New Organic-inorganic Composite Emulsion and Its Enhanced Mechanical Properties of Oil Well Cement(Part 1)
- Construction of A New Organic-inorganic Composite Emulsion and Its Enhanced Mechanical Properties of Oil Well Cement(Part 2)
- The Application Prospects of DeepSeek Large Model in Petroleum Engineering(Part 1)
- The Application Prospects of DeepSeek Large Model in Petroleum Engineering(Part 2)
- Development and Performance Evaluation of Efficient Asphalt Dispersant (Part 1)
- Development and Performance Evaluation of Efficient Asphalt Dispersant (Part 2)
- Development and Performance Evaluation of Efficient Asphalt Dispersant (Part 3)
- Research and Application Status of Drilling Fluid Plugging Materials (Part 1)
.png)
This article combines the calculation method of shale reservoir permeability, embedded discrete fracture model, and oil-water two-phase flow mathematical model to propose a numerical simulation method for shale oil well productivity considering the oil-water two-phase flow characteristics under the influence of shale pore structure. The spatial distribution characteristics of fracturing fluid in shale oil reservoirs and oil well productivity after volume fracturing are analyzed, and the integrated evaluation of micro oil-water two-phase flow characteristics of shale and macro oil well productivity is achieved.
1.Mathematical Models and Solutions
Calculation method for relative permeability of shale oil reservoirs. Based on a capillary permeability calculation model and combined with the actual pore shape and pore size distribution of shale, a calculation equation for oil-water two-phase permeability in shale reservoirs is established. Considering the complex pore shapes in shale reservoirs, a triangular capillary model is used to characterize the shale reservoir. According to the distribution of oil-water in a triangular capillary, the flow pattern of oil-water two-phase in a single capillary can be expressed as:
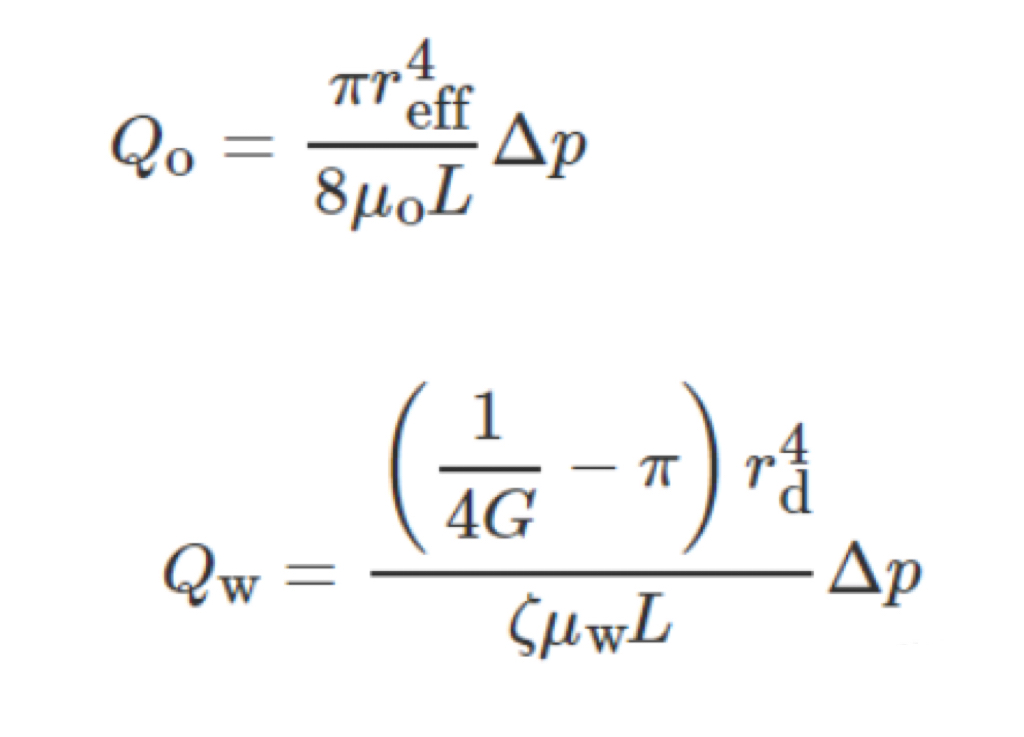
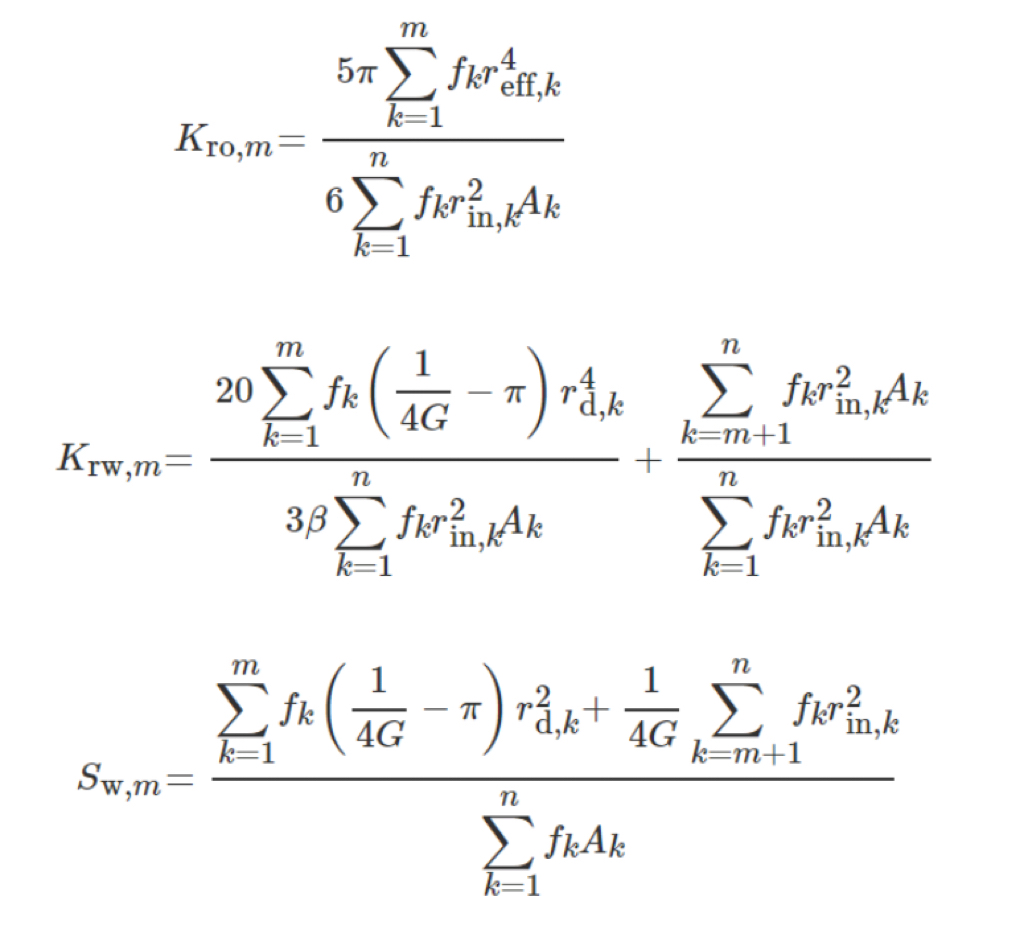
Based on the flow pattern of oil and water in a single capillary and the distribution of shale pore size, the formula for calculating the relative permeability of oil and water in shale reservoirs can be obtained:
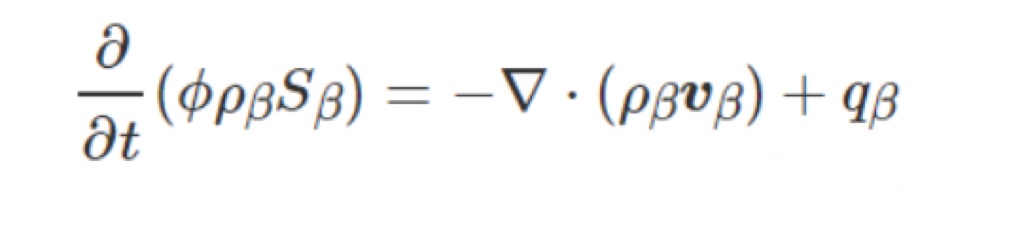
A mathematical model for oil-water two-phase flow in shale oil reservoirs. Considering the oil-water two-phase flow process in shale oil reservoirs, the mass conservation relationship of the oil-water two-phase fluid in the matrix and fractures can be uniformly expressed as a continuity equation.
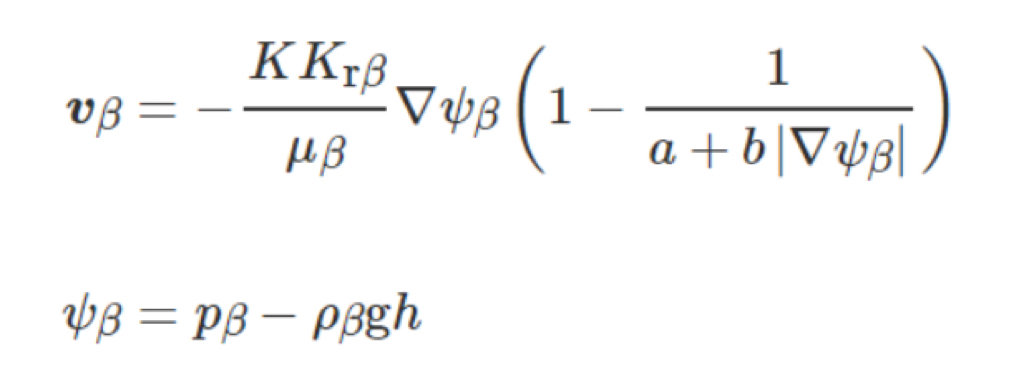
The starting pressure gradient effect usually does not exist in cracks, so the conventional Darcy's law is used to describe the oil-water two-phase flow process inside cracks:
Solution methods for shale oil reservoir seepage model. Geometric discretization and mesh generation of complex fractures in shale oil reservoirs after volume fracturing based on embedded discrete fracture models (see Figure 1). For a given volume fractured shale oil reservoir model, a structured grid is used to divide the substrate region, and hydraulic fracturing and natural fracture networks are embedded into the divided structured grid. The structured grid boundary is used to cut the fracture network, forming a discrete fracture grid element, and comprehensively forming a grid element system for numerical simulation of shale oil reservoirs.
.png)
2.Simulation Analysis of Fracturing Fluid Distribution and Production Capacity in Shale Oil Reservoirs
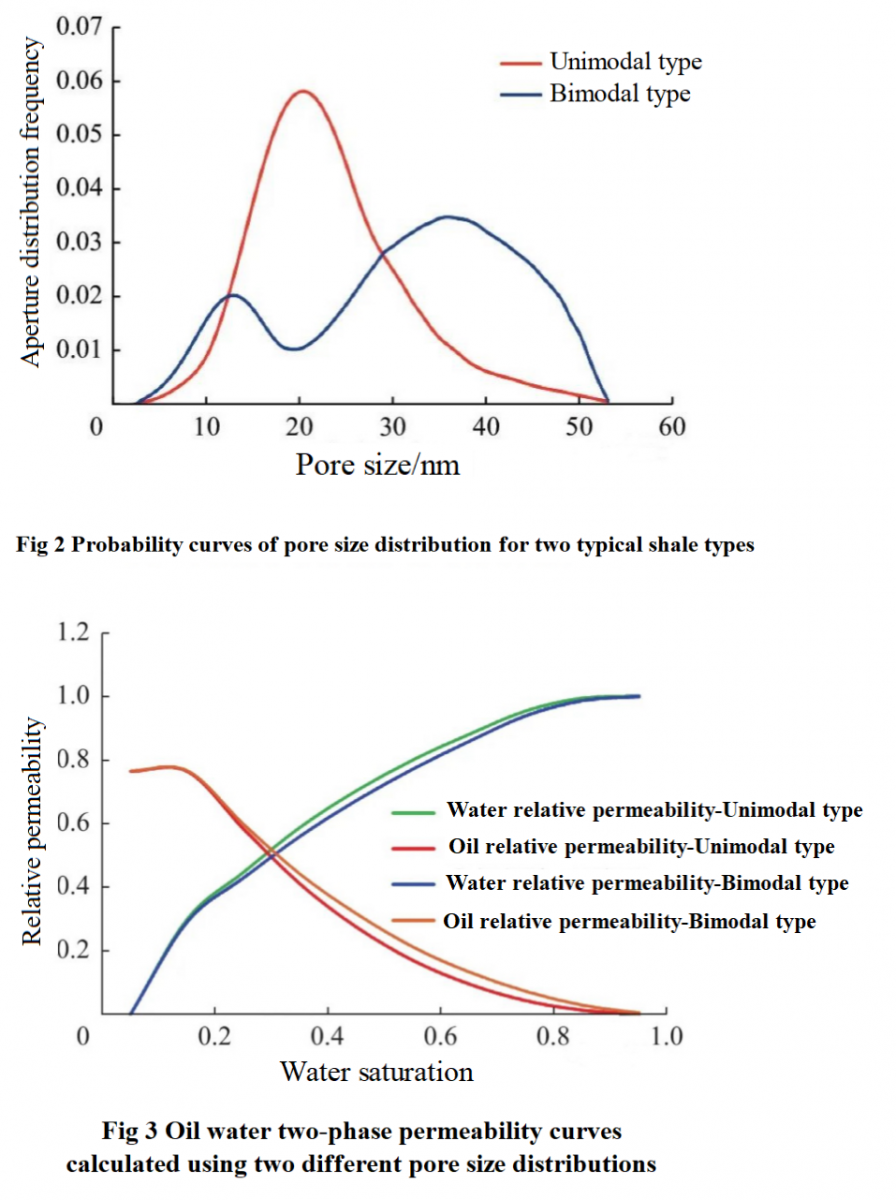
Calculation of oil-water relative permeability in shale oil reservoirs. Selecting two typical pore size distributions of shale, namely unimodal pore size distribution and bimodal pore size distribution (see Figure 2), based on the same pore shape parameters, the relative permeability of oil and water was calculated using the shale reservoir permeability calculation method. The results are shown in Figure 3.
Analysis of distribution characteristics of fracturing fluid in shale oil reservoirs. Based on the geological and fracturing design data of a shale oil well in Shengli Oilfield, combined with an embedded discrete fracture model, a volume fracturing shale oil reservoir model is established (see Figure 4). The simulation results of the pressure and water saturation distribution in the shale reservoir substrate and fractures after injecting fracturing fluid are shown in Figure 5. The pressure and water saturation distribution in the substrate and fractures after 30 days of plugging after fracturing are shown in Figure 6.
.png)
.png)
.png)
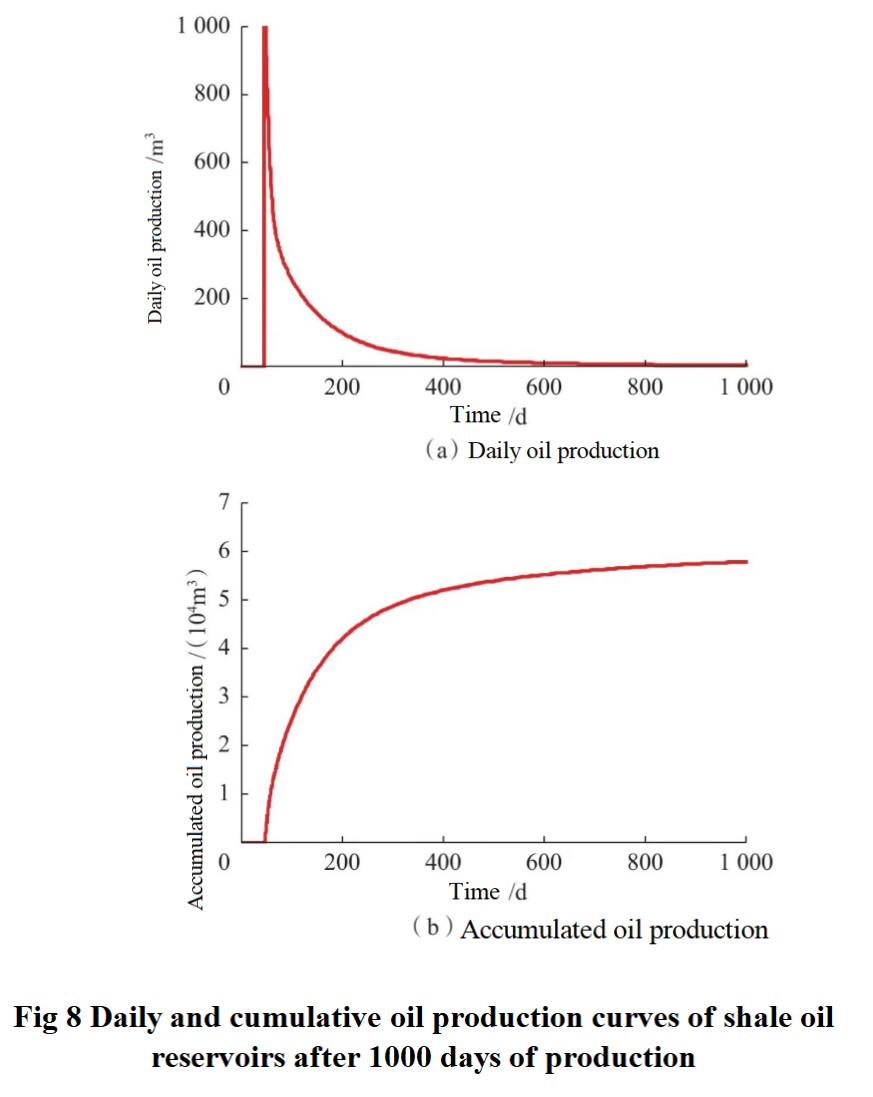
Analysis of post fracturing production capacity of shale oil reservoirs. The pressure and oil saturation distribution in the reservoir substrate and fractures after 1000 days of depleted development are shown in Figure 7. The daily oil production and cumulative oil production curves of shale oil reservoirs with a production capacity of 1000 days are shown in Figure 8. From this, it can be seen that due to the characteristics of shale oil-water two-phase flow and the influence of capillary force, the flowback rate of fracturing fluid in shale reservoirs is lower after fracturing, but the degree of utilization of shale reservoirs after volume fracturing is better.
.png)
3.Conclusion
1) Considering the characteristics of oil-water two-phase flow under the influence of shale pore structure, the numerical simulation method for the production capacity of fractured shale reservoirs can achieve the full process evaluation of the relative permeability of oil and water, the distribution and backflow of fracturing fluid, and the production capacity of oil wells in shale reservoirs.
2) Based on the pore size distribution and pore structure parameters of shale reservoirs, the capillary model can be used to obtain the relative permeability of oil and water in shale reservoirs. There are significant differences in the relative permeability of oil and water under different shale pore size distributions.
3) Fracturing fluid is mainly distributed in the natural fractures and matrix around the fractures. In the closed well stage, it enters the surrounding matrix, and the capillary resistance of the matrix causes a lower flowback rate of the fracturing fluid. However, the shale oil reservoir after volume fracturing has a better utilization range and degree.