


Case Studies
Case Studies
- Preparation of Hyperbranched Resin and Its Effect on the Performance of Epoxy Resin Channeling Control Agent (Part 1)
- Preparation of Hyperbranched Resin and Its Effect on the Performance of Epoxy Resin Channeling Control Agent (Part 2)
- Construction of A New Organic-inorganic Composite Emulsion and Its Enhanced Mechanical Properties of Oil Well Cement(Part 1)
- Construction of A New Organic-inorganic Composite Emulsion and Its Enhanced Mechanical Properties of Oil Well Cement(Part 2)
- The Application Prospects of DeepSeek Large Model in Petroleum Engineering(Part 1)
- The Application Prospects of DeepSeek Large Model in Petroleum Engineering(Part 2)
- Development and Performance Evaluation of Efficient Asphalt Dispersant (Part 1)
- Development and Performance Evaluation of Efficient Asphalt Dispersant (Part 2)
- Development and Performance Evaluation of Efficient Asphalt Dispersant (Part 3)
- Research and Application Status of Drilling Fluid Plugging Materials (Part 1)
2.Results Analysis
2.1 Results of Uniaxial and Triaxial Experiments
2.1.1 Uniaxial Experimental Results
Taking the results of sample 2 as an example for analysis, Figure 2 shows the uniaxial compression test results of sample 2. It can be seen that deformation and failure are divided into three stages: elastic deformation, plastic deformation, and ring breaking. After reaching the stress peak, the sample rapidly drops, and the stress-strain curve shows elastic-brittle characteristics. The tested compressive strength is 32.92 MPa, and the corresponding strain at failure is 1.01%. Through calculation, the elastic modulus of sample 2 is 6.88 GPa, and the Poisson's ratio is 0.113.
.png)
2.1.2 Triaxial Experimental Results
Figures 3 and 4 show the triaxial compression test results of cement stone for samples 4 and 7, respectively. From the figure, it can be seen that the deformation and failure have changed from the original three stages to only two stages: elastic deformation and plastic deformation. The curve grows directly in a linear state; Subsequently, the growth rate decreased, indicating damage to the specimen, and the cumulative plasticity gradually increased, ultimately reaching its peak. By comparison, it can be seen that as the confining pressure increases, the peak value of the plastic stage increases. The sample exhibits strong elastic-plastic characteristics throughout the entire process. The sample results show a typical triaxial shear failure mode.
.png)
.png)
2.1.3 Analysis of Uniaxial and Triaxial Test Results
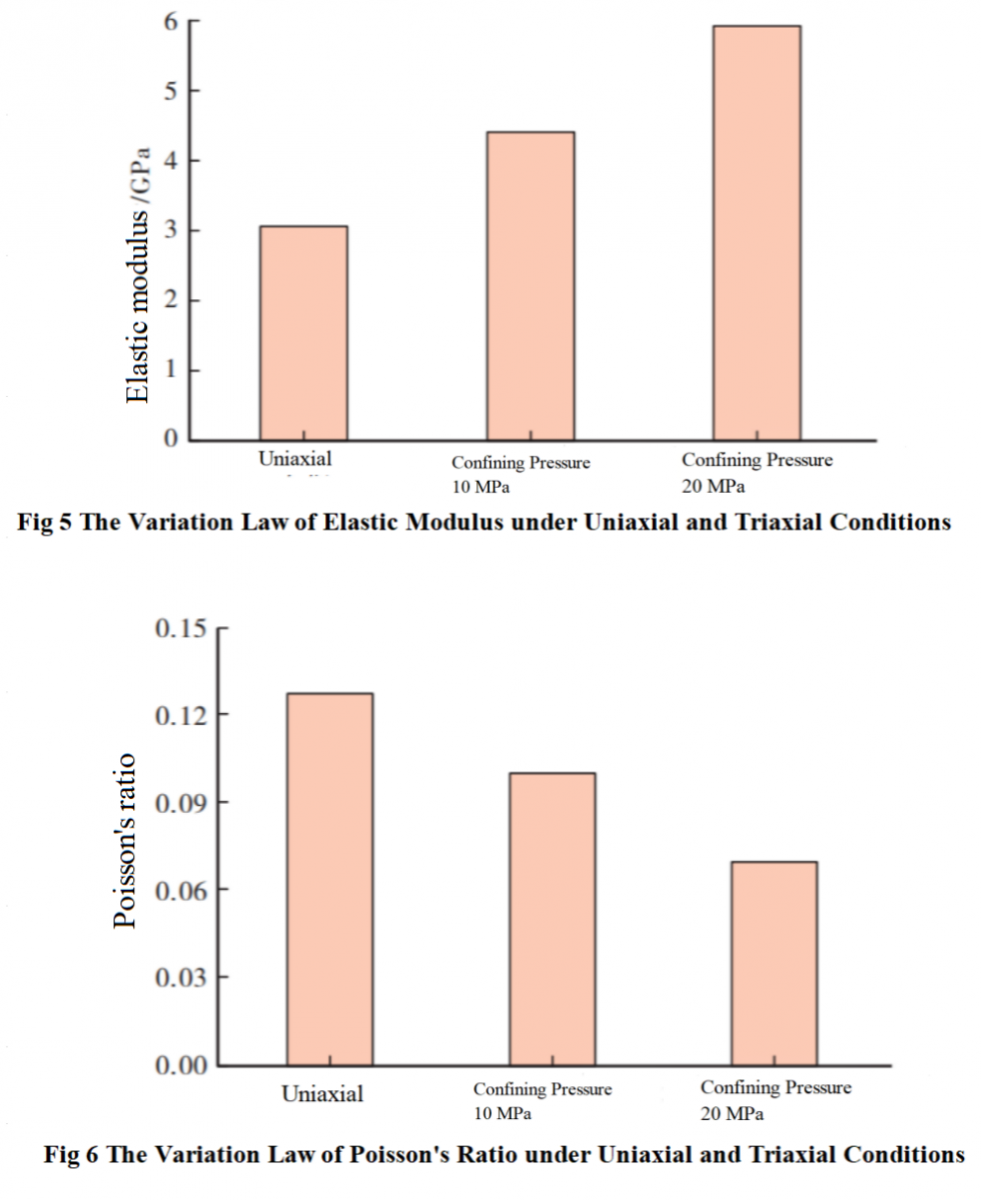
Figures 5 and 6 show the experimental results of elastic modulus and Poisson's ratio under uniaxial and triaxial conditions, respectively. It can be seen from the figures that the average elastic modulus of cement under uniaxial experimental conditions is 3.054 GPa, and the average Poisson's ratio is 0.127; Under a confining pressure of 10 MPa, the average elastic modulus of cement is 4.409 GPa, and the average Poisson's ratio is 0.100; Under a confining pressure of 20 MPa, the average elastic modulus of cement is 5.94 GPa, and the average Poisson's ratio is 0.069. According to the analysis of experimental results, as the confining pressure increases, the compaction effect becomes stronger, the elastic modulus of cement increases, and the Poisson's ratio decreases.
2.2 Results of Cyclic Loading Experiment
Figure 7 shows the experimental results of cyclic loading under different peak stress conditions.
.png)
From Figure 7, it can be seen that during the first loading process, the stress-strain curve pattern is similar to the curve pattern of the triaxial compression experiment, showing obvious elastic-plastic characteristics. The larger the stress loading value, the more significant the plastic characteristics of the curve. During the stress unloading process, the stress-strain curve did not show obvious elastic recovery characteristics. When the compressive stress dropped to the lower limit pressure, the strain at this time decreased compared to the peak strain. The strain at this time is defined as plastic cumulative strain or residual strain. As the compressive stress increases, a new stress-strain curve is generated and intersects with the previous unloading curve, forming a hysteresis loop. During the subsequent cyclic loading process, the hysteresis loop continuously shifts to the right, indicating an increasing cumulative plastic strain. However, from the distribution of hysteresis loops, the width of the hysteresis loop of cement stone gradually decreases, and the density gradually increases. During the cyclic loading process, it has obvious cyclic hardening characteristics, that is, the deformation resistance continuously increases and the strain gradually decreases.
Further extract the cumulative plastic strain of cement stone after each unloading, and the comparison results are shown in Figure 8. It can be seen that the cumulative plastic strain law is basically the same under different peak stress loading conditions. The overall cumulative plastic strain shows a bilinear increase law, and the larger the peak stress, the more significant the plastic cumulative effect. Taking the 70% peak stress test result as an example, the plastic strain increment after the first unloading was the highest, reaching 1.43%, and the plastic strain increment after the 20th unloading was 2.46%. This experimental result further confirms the mechanism of micro annular gap generation during multi-stage fracturing process.
.png)
2.3 Results of Bond Strength Experiment
2.3.1 Shear Bonding Strength
Figure 9 shows the shear bonding strength test curve and the sample failure situation. After testing, there was significant displacement on both sides of the bonding surface, and the bonding surface failed to separate. From the analysis of the displacement load curve during the testing process, it can be seen that there are load peaks in all curves, which correspond to the moment when the bonding surface undergoes shear failure, that is, the shear bonding strength. According to Figure 9, the shear bonding strength of sample S5 (cement/shale) is 0.302 MPa, and the shear bonding strength of sample S10 (cement/steel block) is 0.330 MPa. After the failure of the bonding surface, the load rapidly decreases and tends to stabilize, which is related to the sliding friction between the interfaces.
.png)
Table 3 shows the shear bonding strength test results of cement/shale and cement/steel blocks. According to Table 3, the average shear bonding strength of cement/shale is 0.293 MPa, and the average shear bonding strength of cement/steel blocks is 0.336 MPa. The bonding strength of cement/steel blocks is about 14.7% higher than that of cement/shale. Shale has the characteristic of water absorption and softening. When shale comes into contact with cement slurry for water absorption and softening, a mechanical weak layer will form at the shale interface, resulting in lower tangential bonding strength of cement/shale compared to cement/steel blocks.
.png)
2.3.2 Tensile Bonding Strength
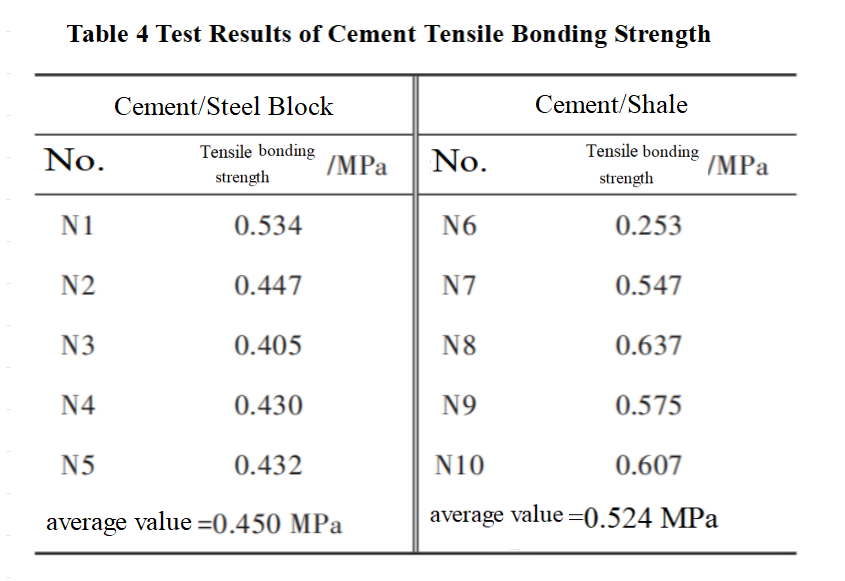
Figure 10 shows the tensile bonding strength test curve and the sample failure situation. The failure positions of the samples all occurred at the bonding surface, indicating that the experiment successfully measured the bonding strength, rather than the tensile strength of the cement stone itself. The peak value of the displacement load curve also corresponds to the moment of tensile failure. According to Figure 10, the tensile bonding strength of sample N1 (cement/steel block) is 0.534 MPa, and the tensile bonding strength of sample N10 (cement/shale) is 0.607 MPa.
.png)
Table 4 shows the tensile bonding strength test results of cement/shale and cement/steel blocks. According to Table 4, the average tensile bonding strength of cement/shale is 0.524 MPa, and the average shear bonding strength of cement/steel blocks is 0.450 MPa. The bonding strength of cement/shale is about 16.4% higher than that of cement/steel blocks. Although shale has poor permeability, some cement hydration products still invade the interior of shale before cement solidification, resulting in higher normal bonding strength of cement/shale after solidification compared to cement/steel blocks.
3 Discussion and Analysis
Cementing cement sheath is one of the key barriers in the wellbore. The loading and unloading of the casing pressure multiple times during multi-stage fracturing poses a serious challenge to the sealing integrity of the cement sheath in the wellbore. At present, the main parameters for testing the performance of cement stone include elastic modulus, compressive strength, tensile strength, flexural strength, etc. These key parameters can better reflect the service performance of cement stone in conventional oil and gas wells, However, it is not possible to quantitatively discuss the mechanical behavior of cement stone during multi-stage fracturing. Therefore, it is necessary to develop relevant experimental plans or standards for the service environment of shale oil well cement stone, in order to analyze its integrity under multi-stage fracturing conditions.
During the multi-stage fracturing process of shale oil wells, there are significant differences in the stress state of the cement sheath at different depths and openings. From a mechanical perspective, when the radial stress exceeds the compressive strength, the cement sheath undergoes compression failure; When the radial stress is greater than the elastic limit but less than the compressive strength, plastic accumulation will occur in the cement sheath during multi-stage fracturing, increasing the risk of micro ring gaps. From the distribution pattern of casing internal pressure and geostress with well depth, it can be seen that the depth of the well where micro annular gaps appear is relatively shallow, and the depth of the well corresponding to compression failure is relatively deep. Due to the different forms of fracturing, the corresponding mechanical behaviors are also different. Therefore, it is necessary to conduct parameter optimization analysis for cement slurry systems in different well sections.
4 Conclusion
1) Under uniaxial loading conditions, cement paste exhibits certain elastic-plastic failure characteristics. When there is confining pressure, the stress-strain curve of cement paste exhibits more significant plastic failure characteristics.
2) Under cyclic loading conditions, the cumulative plastic strain of cement paste shows a bilinear relationship with the number of loading cycles, but the plastic increment mainly forms in the first loading process. As the number of loading cycles increases, the hysteresis loop gradually shifts to the right, but the amplitude decreases, indicating that cement paste has the characteristic of cyclic hardening.
3) A new method for testing cement bonding strength has been designed, which can accurately identify the moment of shear and tensile failure of the bonding surface, quantitatively characterize the mechanical properties of the cement bonding surface. The bonding strength of the test samples is all less than 1 MPa, far lower than the strength of the formation rock and cement sheath body. Therefore, the cumulative plastic deformation of the cement sheath during the multi-stage fracturing process can easily lead to the formation of micro annular gaps.